Alright, we took a little decimal license with that one. The actual headline that appeared on Fox Business Network’s After The Bell was “DOW GAINS .02%.” It should have appeared on WGSC, better known to Howard Stern aficionados as “the Who-Gives-A-Sh*t Channel.”
This is all noise, zero signal. Every daily change in the Dow is. Even the historic ones are. Every daily change in just about anything is.
As self-aware humans, we plan. That’s largely a good thing. The act of, say, enrolling in college happens with the understanding that 4 or more years down the road, and decades beyond, it’ll start paying off. Even the simpler act of planting a tree is done with a nod to a future that the planter might never be alive to see. Having kids goes on this list too, of course.
Yet for some reason, when regarding the stock market, we become mayflies. It’s as if we’re thinking, “But if the Dow fell 20 points this morning, how am I going to be able to retire at 7 p.m. and live off my investments from then until midnight?” If you want, you can blame the journalists for this: they have to talk about something, and the stock market is pretty much guaranteed to close at some level on every day that it’s open. (Curiously, the days that the Dow doesn’t close at any level are the truly newsworthy ones. 9/11, for instance.)
There’s too much information in every realm, not just finance and business. The only parts of the daily news that always contain legitimately important and timely information are sports and weather. The fluctuation in Archer Daniels Midland stock or the price of gold means nothing to the average investor over the course of a day, a week, a month, even longer. To illustrate the point, here’s the market level at yesterday’s close of business:
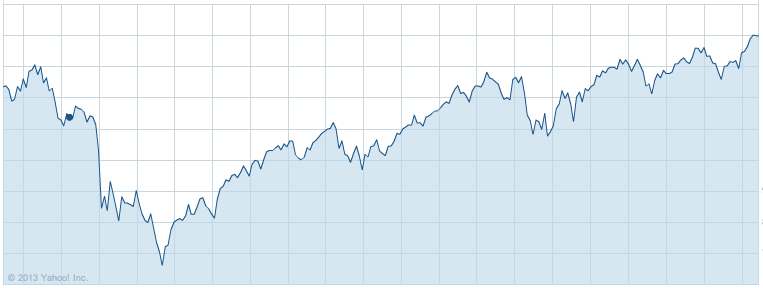
No, wait. This is the market level at yesterday’s final bell: 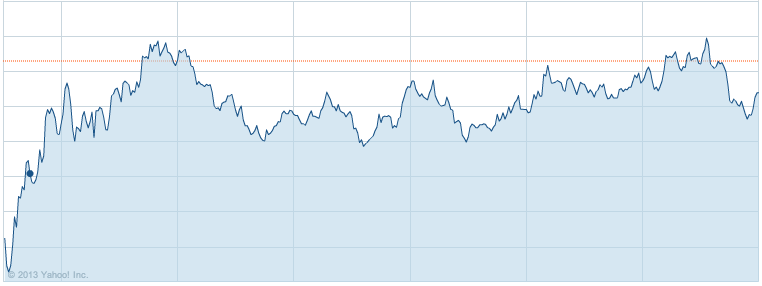
Oops. Sorry. No, it’s this:
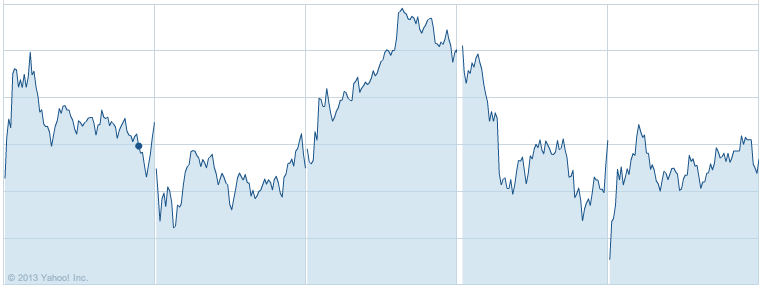
Wait wait wait wait wait. Swear to God, this is it:
In ascending order of length, the periods represented by these graphs are day, a week, 2 years and 5 years. But do you have any idea which is which?
(Answer: 5 years, a day, a week, 2 years.)
We removed the numbers on the vertical axis, and there’s no sense of scale, but that’s not the point. Whether you believe in a “permanent bull market” or not, a continually rising line isn’t visible in any of these charts. The 1-day changes seem considerably less abrupt than the 1-week changes, which would be unlikely in a rational world.
Tune out. Here’s a challenge, with absolutely no reward from us if you meet it: examine your portfolio no more than quarterly. Some wags would replace “quarterly” with “annually”, but we’re not at that level quite yet. What happens hour-to-hour is of zero consequence, and what happens over a period of weeks isn’t much more critical.
Look at other investments, ones whose price isn’t as easy to calculate. You bought your house in the hope that it’ll appreciate in value, right? If your $150,000 three-bedroom gets assessed at $149,703, what are you going to do? Sell sell sell? Pray for a bump? Or live your live confident that your house is an asset with a permanent tangible value, and that should you ever want to sell it, today’s prices will bear no relationship to those future prices?
Unplug. Read a book. Play with your kids. Go cycling. Whatever you do, don’t fool yourself into thinking that exposure to an onslaught of financial information is necessarily going to educate you. While you’re at it you ought to stop reading other personal finance blogs and just concentrate on this one. And read it largely for entertainment. (Which makes it sound as though our advice is unserious or unimportant, which is untrue. We meant entertainment in the literal sense: be entertained, while absorbing subject matter that can often be dry depending on who’s presenting it.)
It’s a cliché, but a valid one: for the most part, you make your money going into an investment, not out of it. Buy undervalued assets, and wait for them to appreciate. A stock bought at the top of the market – for example, Enron at its localized zenith – is not an undervalued asset. For a more contemporary and less notorious example, take Amazon, which is close to its current (and all-time) peak of 276½ or so. A fixation on short-term movements, no matter how drastic, will rapidly drive you insane. Considering your presumed lifespan, you want any eventual insanity to manifest itself as slowly and methodically as possible.
The average daily movement in the Dow is less than .026%. Or as CNBC might put it, “DOW UP .026%!!!!!!!!!!!!!” Journalists, even financial ones, are not renowned for having perspective. You’re smarter than that.

