Like Warren Buffett’s In This To Lose Money

You see, kids, back in 1982, color photography hadn't been invented yet

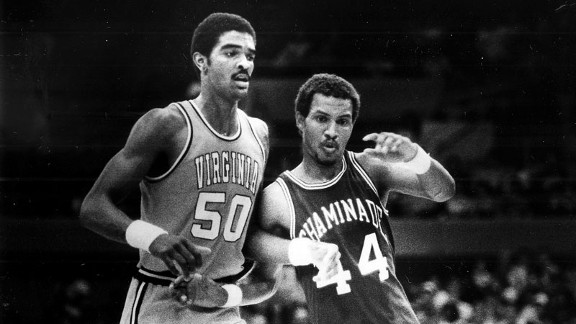
You see, kids, back in 1982, color photography hadn’t yet been invented


Humans are atrocious at assessing risk. That’s why there are mothers who won’t let their kids visit the house of a friend whose parents own a gun, but who have no problem allowing their friends to visit a house that features that child abattoir called a swimming pool, even though Junior is hundreds of times more likely to die at the latter house than the former.

Humans are also, for the most part, rotten at math. That’s why Quicken Loans can offer ONE BILLION DOLLARS (really, half a billion dollars) to someone who can select a perfect NCAA Division I Mens’ Basketball tournament bracket, and people will take it seriously. Here’s the truth:

You’re not going to win it, but on the other hand, nobody else will. That simple sentence alone isn’t enough to convince most people. They know that someone wins Powerball and Mega Millions every few weeks, so why should the Quicken Loans Bracket Challenge be any different?

(Note: Quicken Loans is offering the $500 million, but Warren Buffett is underwriting the promotion. He doesn’t need to underwrite it – your poor alcoholic cousin could do just as good a job, for the negligible risk incurred – but Quicken Loans is paying Buffett for the privilege of the insurance. $10 million. Yes, the one person who’s going to make f.u. money from this is the guy who already has $60 billion.)

The problem is that most people can’t distinguish between one large number and the next. After all, aren’t they all pretty much the same once you get past 1 million?

The odds of picking 64 games perfectly, straight-up, is 9,223,372,036,854,775,808-to-1. We can call that 9.2 quintillion-to-1 and it’s not going to alter our calculations significantly. The odds of winning Mega Millions are 258,890,850 to 1. It’s 36 billion times more likely you’ll win Mega Millions (which you won’t, but at least somebody will) than that you’ll fill out a perfect bracket.

Let’s say there’s a nationwide lottery in the United States. Every citizen gets one entry, and there are 2 drawings. The chance that the same person would win both drawings is about 1% of the chance that someone’s going to take Quicken Loans’ $500 million.

Some of you who are particularly sharp are thinking, “Come on. A 16-seed isn’t going to beat a 1-seed. That narrows the odds significantly.” And you’re right. Throughout history, the 1-seeds have won their opening games 100% of the time. The 2-seeds, 99%. If you take all the favorites in every round, the odds reduce to 7,419,071,319-to-1. Assuming not a single 9-seed beats an 8-seed. Which, you know, never happens.

Here’s Juliet Lapidos, a lady who works as a staff editor at the New York Times. Ms. Lapidos “holds a B.A. in comparative literature from Yale University and an M.Phil. in English literature from the University of Cambridge,” so if you’re looking for someone perfectly innumerate, the closest thing to an anti-Peter Lax, she’d be close to an optimal choice.

ESPN has run a March Madness contest for the last 13 years and no one has ever completed a perfect bracket.

That’s like saying no one has ever been trampled to death by a left-handed female African elephant on the inside lane of the southbound Lake Pontchartrain Causeway while whistling Ennio Morricone’s “Ecstasy of Gold” and spinning 11 plates on sticks, 9 of them clockwise and 2 counterclockwise. Of course it’s never happened in 13 years. It won’t happen in 13 trillion. That someone felt the need to point this out is part of the problem.

We can’t understand why Quicken Loans restricted the contest to the first 15 million entrants. Keep in mind, all the entrants have to submit personal information in their quest for money they’re never going to win. That’s a database of potential borrowers that no company this side of Facebook can put together easily. (Bonus: Facebook somehow gets information from people without offering them a chance at any money. Mark Zuckerberg is even smarter than you thought.)

Even assuming the favorites were going to win every matchup, is $500 million worth your while? Not a ridiculous question. Given the odds on completing a perfect bracket under the condition that every favorite win, then $500 million would be a fair payout on a wager of 13¢. Your information as a would-be customer is worth more than that to Quicken Loans, even assuming that you probably won’t get a mortgage from them. One more time, and we’ll say this until you’re sick of it: look at every transaction from the perspective of the other party. Why would Quicken Loans feel like giving money away for no reason at all? Does Warren Buffett make it a habit of losing money on investments? (Especially when he can determine the probabilities in advance?) This is a way for Quicken Loans to combine market research and data mining into one campaign, and get the media, primarily Yahoo, to do the work of promoting it. It’s also a way for Warren Buffett to profit off someone else’s inability to properly assess risk. Bet the NBA instead, the lines are truer.

Part 3 of Our Ongoing Saga About Risk, Which Is Fortunately A Trilogy

Here’s Part II. No, wait: Here’s Part I. Read those first, there’ll be an open-book quiz.

We’re explaining what all these mutual fund risk measurements mean. Yes, you want to know how much your mutual fund has gained and might likely gain, but the professionals have collectively decided that you need to know not only your fund’s propensity for gain, but how risky said fund is. Thus they applied some formulae to price swings, creating α, β, R², σ (that’s a lowercase sigma, the equivalent of the Roman letter S, the first letter in “standard deviation”), and two other quantities that are named after people with Anglo-Saxon names and thus aren’t symbolized with a Greek letter:

One more DODGX screenshot

Sharpe and Treynor ratios. What are they and do we care? Let’s answer the 1st question 1st.

William Sharpe is a 79-year-old Stanford professor and Nobel laureate. Decades ago, he tried to determine how much of a given investment’s returns are due to sagacity on the part of the investor, and how much are due to risk. If black 17 comes up and pays you 36-to-1, that means you’re 0% a shrewd roulette player, and 100% someone who benefitted from the inherent risk. The formula for the Sharpe ratio is relatively simple, so much so that it’s kind of amazing no one thought of it before the 1960s.

Start with the investment’s average rate of return, in this case over a 3-year period as indicated in the chart. Subtract the best available risk-free rate of return, like what you’d get from short-term government bonds – 10-year T-bonds, to be specific. Which, over the last few years, has been effectively zero. Then divide the difference by the standard deviation, which we explained Wednesday and which is a measure of how much monthly returns fluctuate with regard to the average. The theory goes that if you measure an investment by its excess return per unit of standard deviation, you’re focusing on how well the investment does on its own merits rather than how well it’s doing given its inherent risky nature.

The advantage of Sharpe ratio over α and β is that Sharpe ratio rates an investment on its own merits, rather than against a benchmark. The downside is that our denominator, standard deviation, can fluctuate for a host of reasons.

So what does a Sharpe ratio of 1.19 mean? Is it high, low? As always, it depends on the asset class. As you can read, Sharpe ratios in the Dodge & Cox Stock Fund’s asset class run around 1.12. DODGX beats the average by a few points, meaning that the data could be interpreted as evidence that DODGX’s managers are operating more on skill and less on luck than are their counterparts and competitors. T-bills have a Sharpe ratio of 0, and of course return less than T-bills’ means a negative Sharpe ratio. With time, as returns normalize, Sharpe ratios reduce. DODGX’s Sharpe ratio over the last 5 years is .59, and over the past decade .45.

Jack Treynor is a financial analyst with fewer academic credentials but almost certainly more money than William Sharpe. He developed his competing ratio a few years before Sharpe. Treynor ratio is identical to Sharpe ratio, except the former divides excess return (over T-bills) by β instead of by standard deviation. In other words, Treynor ratio measures returns with regard to market risk, instead of total risk. DODGX’s Treynor ratio is greater than the category’s Treynor ratio over the past 3 years. And the past 5 years, but not the past decade. Again, Treynor ratio compares returns with regard to volatility with respect to a benchmark. Neither Sharpe nor Treynor ratio has anything to say about how actively a fund or a portfolio is managed.

None of this is anything but mathematical masturbation. It’s dividing quantities by other quantities purely for the fun of it. As an investor, your objective is to make money. Not to beat benchmarks, nor to gauge your investments with regard to inherent and/or systemic risks. Most of the wealthiest people we know have no familiarity with any of these measurements, and wouldn’t see any reason for knowing how to calculate them.

You can choke on theory, or you can buy assets and sell liabilities. It really isn’t more complicated than that. The various risk measurements are nothing more than intellectual curiosities, the kind of stuff that the Nobel committee loves and that university business schools love even more. After all, it’s more material to add to the curriculum.

Furthermore, there’s a reason why every last piece of financial advice is punctuated with the following phrase: Past performance is not necessarily indicative of future results. α, β, R² etc. are incredibly helpful if you plan on traveling back in time and making investment decisions in the fall of 2010. In the market, there’s no better investment than a temporarily wounded stock. Until the academics learn how to quantify the implications of a Carnival Corporation ship capsizing or an iteration of Microsoft’s Windows 8 software being released with bugs, you’re better off looking for something undervalued and exercising patience.


Part II of Our Exhilarating Series About Risk

You’re not going to understand this unless you read Part I, and you probably won’t understand it even then. That’s a criticism of our ability to explain things, not your ability to absorb them.

Last week we tried to figure out what those measures of risk under a mutual fund’s chart mean. Here’s the chart for the Dodge & Cox stock fund, updated from last week. The numbers for the fund itself haven’t changed, as Yahoo! hasn’t recalculated them since September 29 (and we can’t be bothered to do it ourselves), but the numbers for the fund category itself have changed:

Dodge & Cox II

α and β we handled last time out. What about Mean Annual Return, R², standard deviation, and Sharpe and Treynor ratios? Let’s see if we can do this and still retain your interest.

Mean Annual Return. “Mean” means average, right? Yes, but there are different kinds of averages. Note the time period listed in boldface on the chart. This isn’t the standard (arithmetic) average, calculated by adding up the values of a bunch of items and then dividing by the number of items. This is geometric average. Replace “adding” with “multiplying” and “dividing by” with “taking the nᵗʰ root, where n is” in the previous sentence and you’ve got it.

Here’s the difference. For instance, what’s the average of 5, 6 and 7?

Screen Shot 2013-10-15 at 3.08.50 PM

That’s the arithmetic average. (Ignore the vertical line down from and to the left of the 3, it’s just a typo.) Here’s the geometric average:

Screen Shot 2013-10-15 at 3.09.16 PM

Not quite the same. Geometric average is necessary when calculating returns over a period of years. If you use arithmetic average it’s confusing and paints an inaccurate picture. Anyhow, by measuring the individual annual increases (or decreases) and calculating their geometric mean, we know that over the past 3 years the Dodge & Cox Stock fund has averaged a 1.46% gain, which beats the category.


Now onto. It’s a measure of spread, which is contingent on mean (which, for our purposes, means mean annual return.) R² is supposed to separate how much of that return is attributable to the fund itself from how much is attributable to the underlying benchmark – here, the standard index. If DODGX is just riding the market’s coattails, we want to know about it. The lower R² is, the more the fund’s performance is its own doing, for better or worse. You calculate R² by graphing the performance of both entities, the fund and the index, over time. They won’t be identical, of course. You measure the difference between the fund and the index at different points, square the differences, and in this case discover that DODGX’s movements are explained almost entirely by the index. 96.5 on a scale from 0 to 100. Some if not most people prefer funds with high R², the argument being that a rising index lifts the boats that are most in sync with it.

Generally, R² of over 90 is considered high. R² of under 70 is considered low.


What about standard deviation? Like R², this is a general statistical term that applies to all sorts of sciences, not just finance. If you didn’t learn it in high school or college, here it is in its simplest form. Take 5, 6, and 7, the data points that served us so well in the previous example. Their (arithmetic) mean is 6, we know that. Just like the mean of -40, 27 and 31 is also 6. But obviously, the first set of values is a lot tighter than the second. In other words, their standard deviation is lower. You calculate standard deviation by

  • Subtracting each term from the average.
  • Squaring each of those differences. 
  • Adding them all together.
  • Dividing by the number of items.
  • Taking the square root of that. 

Again, we don’t expect you to calculate this yourself. But we’re not just going to throw an unfamiliar term at you and explain it without going into details. We’re writing this in such a fashion that if you want to, you can reproduce the results yourself. Otherwise we’re not really explaining anything, we’re just listening to ourselves type.

Using the 5-step process above, the standard deviation of 5, 6 and 7 is .816. The standard deviation of -40, 27 and 31 is 32.568.

But how does this help us and what does it mean? What are the quantities, the data points we’re dealing with here?

Answer: Monthly total returns. Keep in mind that the table above shows results for only the last 3 years. So we take DODGX’s return in October of 2010, its return in November of 2010, etc., until we have all 36 monthly total returns. (Well, that’s not entirely true. We then annualize them, which is to say, we take each monthly total return to the 12ᵗʰ power.) DODGX’s standard deviation is 14.67, slightly higher than that for its category of funds. That number is a percentage, by the way. It means that assuming a normal distribution – a bell curve – DODGX’s returns will be within 1467 basis points of its average return 68% of the time. It’ll be within 2934 basis points – two standard deviations – of its average return 95% of the time. And it’ll be within 4401 basis points, or three standard deviations, 99.7% of the time. The 68%, 95% and 99.7% aren’t arbitrary, either. They’re natural constants. Well, they aren’t really, but they’re close enough that we can say they are without turning this into an introductory-level probability course.

Alright, it looks like we’re going to have to stretch this out to 3 parts. Friday, we’ll do Sharpe ratio, Treynor ratio, and give you our synopsis of what the point of all this is.