Shortcuts Are More Work Than They’re Worth


“Walton, why do you smell like my grandson’s bedroom?”


In honor of the late John Wooden, this week’s lesson is to work on your fundamentals.

There are two major ways to evaluate stocks: fundamental analysis and technical analysis.

Groan.

Stop whining. This isn’t difficult.

Fundamental analysis means assessing a company’s financial statements: taking the accountants’ work and reaching conclusions with it.

Technical analysis is the financial equivalent of astrology. It involves looking at how a company’s stock is performing – not how the company itself is performing – and using that to figure out what the stock will do.

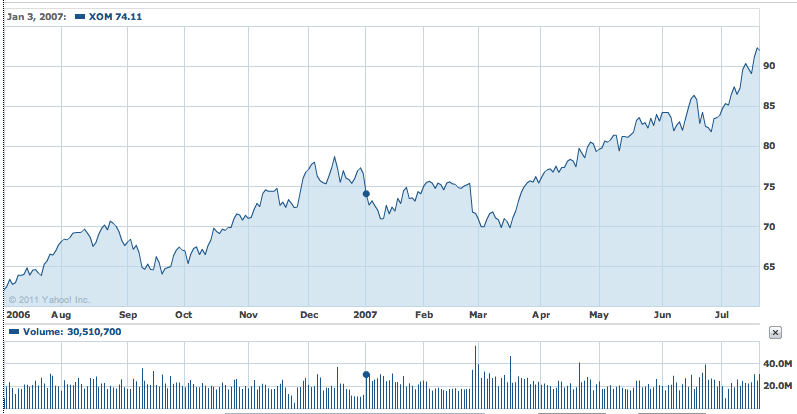
Here’s an example of why that’s insane. This is what ExxonMobil stock did from July 3, 2006 to July 20, 2007:

If you remember, public sentiment at the time ran something like:

The oil companies are bleeding us dry!

They’re fixing prices!

They’re in cahoots with the Bush Administration, the Elders of Zion, the Illuminati and the Trilateral Commission!

What could possibly be a better investment for the short term than a monopolistic, chronic polluter with powerful connections and a product we can’t live without? Any room for me on that gravy train?

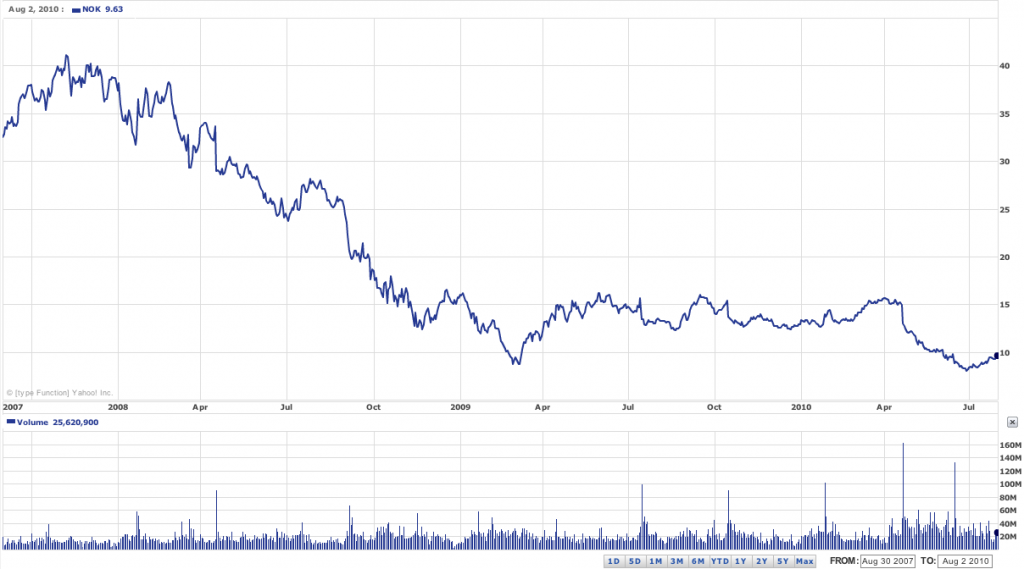
Here’s what ExxonMobil has done since then:

The scale on the y-axis changed, but not by much. What happened?

Centrifugal force happened. Public perception brought the stock up to a level it couldn’t sustain. Then reality set in and the stock got too expensive to attract new investors. In July of 2007, a technical analyst would have measured the angle of ExxonMobil’s rise and expected it to continue its northward progress. That same technical analyst wouldn’t reply to your emails today, assuming you could find him.

Most people who offer stock tips advocate some form of technical analysis. Why? Because it’s easy. It takes .12 seconds to comprehend a chart.

You’ve heard the disclosure phrase “past performance is not necessarily indicative of future results.” Aside from the inelegant use of the passive voice, the statement makes a lot of sense. When a stock picker uses it to keep things all nice and legal, you have to make a couple of logical connections to deduce the message, which is:


That technical “analysis” we sell? This statement renders it invalid.


Everything is cyclical to some extent, right? No stock consistently outperforms the market, because the numbers don’t allow for it. There’s a ceiling, and it’s lower than you think. If the stock of a company with a market capitalization of $20 million were to double every year, within less than a generation it’d outpace the nation’s gross domestic product.

Fundamental analysis means perusing the unglamorous, dry columns of numbers that accompany corporations’ annual reports. It means going through a few years of data and comparing last year’s net revenue numbers to the previous year’s. Determining whether a company’s net profits increased, or if there’s a good reason why they decreased.

“Picking” a stock in the conventional sense – i.e., figuring out which one is going to suddenly jump in value – is a bigger scam than keno. The established stocks – the Dow components, the companies with the largest revenue and profit numbers – are traditionally the stocks with the strongest likelihood of maintaining their value. But because they’re so big, it’s impossible for them to grow that much more. Any company on this list will probably halve in size before it doubles. For a sports analogy (ladies, I’ll make this as easy as possible), Gordon Beckham (.203) is far more likely to raise his batting average by 50 points than Ichiro Suzuki (.358) is. Market conditions prevent the frontrunners from gaining any significant value. It’s the laggards who make the biggest gains.

And suffer the biggest losses.

Continuing with the analogy, Ichiro’s batting average can afford to move 50 points in the other direction. But if Beckham’s does, he’ll be on either the bench or a bus to Charlotte in short order.

This is another place where we see how badly humanity assesses risk. It’s easy to look at the potential for profit, less so to even acknowledge the possibility of loss. From Gilbert & Sullivan’s Utopia, Limited, the librettist suggests that if you’re going to create a company, begin with a trivial market capitalization. Say, 18p:

You can’t embark on trading too tremendous.
It’s strictly fair, and based on common sense.

If you succeed, your profits are stupendous,
And if you fail, pop goes your 18 pence.

A sports analogy, followed by a theater analogy. There, now everything’s in balance.

What’s more likely to hit zero – a company that’s already made its way to consistency, or one that’s closer to being 18 pence away from “popping”?

Of course there’s value in the occasional startup company. If you can find them with any consistency, then please, write this blog for us. You can even rename it after yourself.

And remember: the next coach who tells his team “you need to work on your technicals” will be the first.

**This post is featured in**

The Carnival of Road to Financial Independence #21

and

Stock Carnival Ecstasy

Reading this post will make you sound 477% more financially literate


The Oklahoma/Texas border, as drawn by Muhammad Ali

“The Dow gained 50 points today.”

“The market broke 10,000.”

Do you know what either of those statements mean? To most people “The Dow” and “the market” are somewhat synonymous, but those above numbers remain abstract. Control Your Cash surveyed some of its smartest friends to see who could define the Dow. Here are a few of the answers:

“The volume of industrial stocks traded.”
No.

“An average rating (or price level) of a bunch of important stocks. I think of ‘Fortune 500’ the same way, but I figure ‘the Dow’ includes more stocks, or just stocks that are somehow related to ‘industry’.”
Yes and no.


“The big number that is quoted after the bell every day is an aggregate/average of all the stocks available for public purchase.”
No.


“Isn’t that number somehow based upon the average share price the Dow stocks traded at?”
We’re getting closer.

Things the Dow has nothing to do with:

-strength of the U.S. dollar
-price of gold
-unemployment rate
-bonds
-prime rate
-taxes
-interest rates
-how many stocks were traded yesterday, or how many shares of them were traded.

The Dow’s proper name is the Dow Jones Industrial Average. It’s a number that fluctuates throughout the trading day as particular stocks trade on the New York Stock Exchange. The number is the product of a simple calculation involving the prices of the stocks of a certain 30 companies. Though the companies, and the index, are called “industrials,” that doesn’t necessarily mean that they operate big brick factories with smokestacks. The companies are called industrials to distinguish them from transportation companies, which used to be an important distinction. In 1884 when the Dow was first calculated, railroads and steamships comprised a huge chunk of the economy. (The Dow Jones Transportation Average still exists, though few people outside the airline and trucking businesses pay attention to it.)

The Dow is simply the share prices of those 30 big stocks, added together and multiplied by 7.557486. (We’ll explain the multiplication later.) The companies aren’t the 30 biggest revenue generators in America, or even the 30 most profitable, although there’s lots of overlap. The stocks, with their prices at the close of trading on Friday, October 30 are:

3M 73.57
Alcoa 12.42
American Express 34.84
AT&T 25.97
Bank of America 14.58
Boeing 47.80
Caterpillar 55.06
Chevron 76.54
Cisco 22.81
Coca-Cola 53.31
Dupont 31.82
Exxon Mobil 71.67
General Electric 14.26
Hewlett-Packard 47.46
Home Depot 25.09
Intel 19.11
IBM 120.61
Johnson & Johnson 59.05
JPMorgan Chase 41.77
Kraft Foods 27.52
McDonald’s 58.61
Merck 30.93
Microsoft 27.73
Pfizer 17.03
Procter & Gamble 58
Travelers Insurance 49.79
United Technologies 61.45
Verizon 29.59
Wal-Mart 49.68
Walt Disney 27.37

Those sum to 1285.44. Multiply by 7.557486 to get 9714.69, and you’re done.

Most people are surprised to find out how few stocks comprise the Dow. After all, 1400 other companies trade on the NYSE, to say nothing of the additional thousands that trade on NASDAQ and other exchanges. You won’t find America’s 14th, 15th, 19th and 20th most profitable companies (Philip Morris, Occidental Petroleum, Oracle and News Corporation) on the Dow. Corning, Bristol-Myers Squibb and PepsiCo aren’t far behind, either. Still, the companies on the list represent about ¼ of all the publicly traded market value in the country. The Dow consists of the stock prices of only 30 big corporations because a) there weren’t many more than that back in 1884, and b) if it’s the 19th century and you’re using a pencil, the more companies you add, the longer the average takes to compute. Even with the advent of calculators, for some reason the unrepresentative Dow has remained the benchmark for the market.

Nothing’s permanent, mind you. General Electric is to the Dow as Chester Pitts is to the Houston Texans or Dave Mustaine is to Megadeth: the only remaining original member. On average, a company gets replaced about once a year. Two gigantic and gigantically mismanaged corporations, General Motors and Citi, were politely asked to leave the premises this past year. That’ll happen when your stock falls 99%. They were replaced by Travelers and Cisco.

There are far more comprehensive indices out there. The S&P 500 tracks…well, you can probably figure out how many companies. There’s also a Russell 3000 and a Wilshire 5000. That last one measures the worth of almost the entire market for publicly traded stocks.

Besides exclusivity, the Dow has other limitations. Look at the prices above. Some companies’ stocks trade at 9 times the price of other companies’, yet they’re all weighed equally. The chance of Pfizer stock rising $1 tomorrow is greater than that of IBM stock, simply because Pfizer is so much cheaper and its price thus more volatile. But whether IBM goes up $1 (or .8%) or Pfizer does (5.9%), the Dow rises 7.55749 points either way.

Why the 7.55749? Because of stock splits. Throughout history, some companies – Dow components or otherwise – have tried to attract more investors by doubling (or tripling, decapling, whatever) the number of outstanding shares. This is just an accounting construct that doesn’t change anybody’s actual holdings. If you own 500 shares worth $2 each before a 2-for-1 split, you’ll own 1000 shares worth $1 each after the split. Stocks normally trade in units of 100 shares, so if you wanted to invest in the company for as little money as possible, you’d only have to pay half as much as you would have had to before the split.

Another thing to keep in mind regarding the Dow: the price of a stock doesn’t tell you anything about the health of a company. That’s what financial statements are for. Non-Dow member Google closed at $536.12 Friday. That doesn’t mean Google is 31 times stronger than Pfizer is. For one thing, Google might just happen to be divided into fewer shares than Pfizer. Remember that the Dow, in its simplest terms, reflects nothing more than what people are willing to pay for the stocks of 30 large but disparate companies.

The Dow tells you only a sliver of what’s happening with the economy. Unemployment could reach 25%, an ounce of gold could cost $10,000*, the Chinese could finally cash in that gargantuan IOU and put us all to work tilling yams for Jiang Zemin’s dinner table, but the Dow could still conceivably rise if enough people want to buy enough of the underlying stocks.

There. Now you’re educated.

*Or a dollar could be worth 3.11 Aumg. See this post.